A Multifunctional Solution
Date: 17 February 2023
“The way we use land across Britain is in the spotlight more than ever. Managing our land effectively is a complex issue and, as our population grows, so do the pressures influencing land use1.”
Although Brexit, COVID-19 and, most recently, the impacts of the conflict between Russia and Ukraine have brought the need for balance into much sharper focus, that does not have to mean choosing between food security2 and energy security3. Effective policy can deliver both, as this article describes.
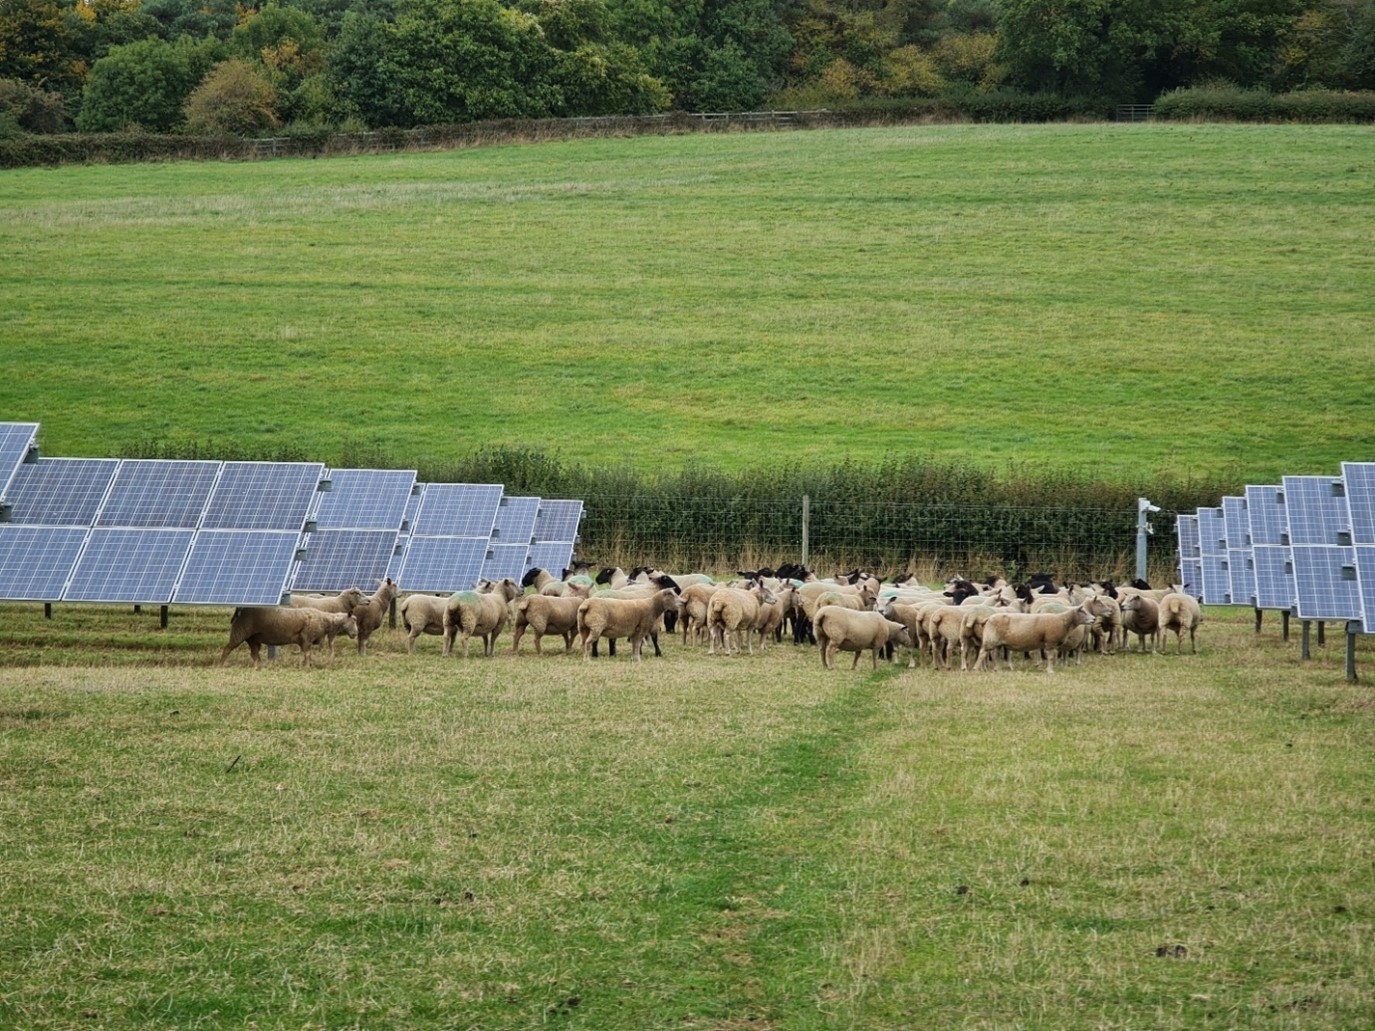
Promoting multifunctional land use across Britain maximises the potential of solar farms to deliver clean energy, improve biodiversity, and address climate change. It also supports long-term food security; providing stable, predictable incomes from lower quality land and reducing the pressure for intensive farming of higher grade land4. Food production and solar energy production are not incompatible, they can happily co-exist on the same land, and they can both complement biodiverse habitats. Agriculture can live sustainably with many different sectors, including agroforestry, agritourism, and regenerative farming, and considerations to maximise natural capital value should be a key factor in land use planning. This will be achieved through a conscious and blended approach, supporting investment into natural capital through regulation, facilitation, incentivisation and stacking of environmental benefits.
The National Food Strategy published in 2020 and 20215, also known as the Dimbleby review, recommended the creation of a new rural land use framework to assess these issues. In December 2022, the Department for Levelling Up, Housing, and Communities then launched a public consultation to seek views on a proposed approach to updating the National Planning Policy Framework (NPPF). Part of the purpose of the NPPF is to consider the economic and other benefits of Best and Most Versatile (BMV) agricultural land. The consultation emphasises the importance of England’s best performing farms and its effect on food security and invites comment on whether greater consideration should be given to how BMV is used6. Government has also committed to publishing a Land Use Framework later this year that will set out an approach to ensure that its objectives for agriculture, the environment and net zero are met through making the most of the UK’s land.
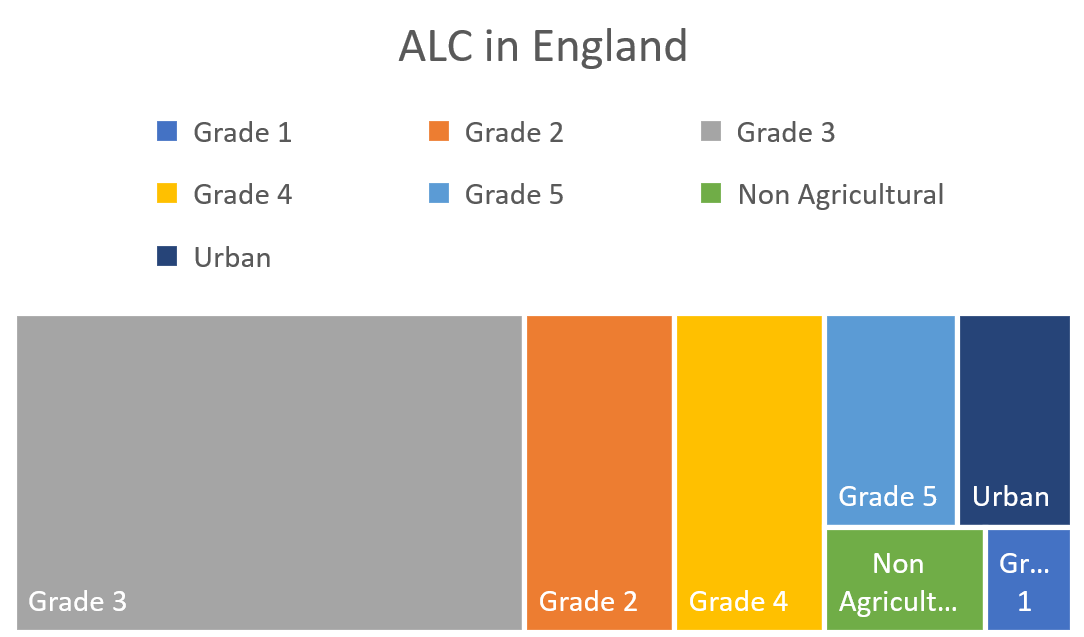
The main conversation on food and energy security in the context of solar in Great Britain to date has been around the topic of Agricultural Land Classification (ALC). However, planning policy already has regard for this system of classification and it should not be the focus of planning reform. Agricultural land is graded under the ALC. First developed in the 1960s, this initially took the form of provisional maps that graded land across five categories, Grades 1 to 5. The ALC system was then revised in 1988 to divide Grade 3 into Subgrades 3a and 3b. BMV was then later classified as land in Grades 1, 2 and subgrade 3a.
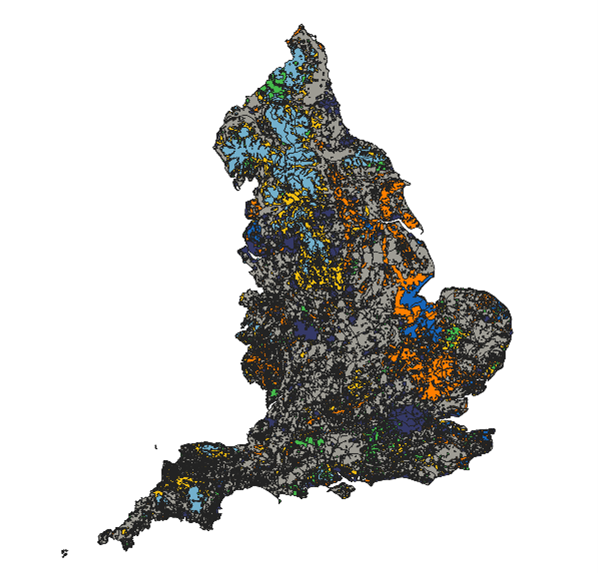
As such, the current dataset in England is predominantly mapped to the original classification system whereby Grade 3 is not subdivided, with the exception of some surveys undertaken between 1988 and 1999. England’s land use classification data, although broad and dated, looks like this:
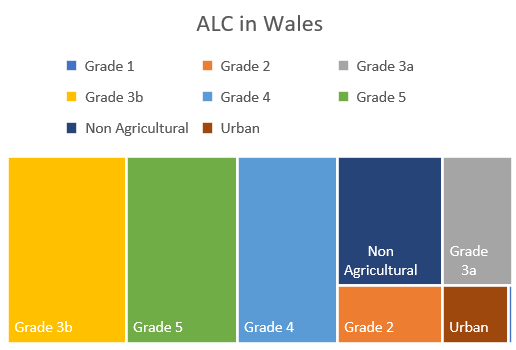
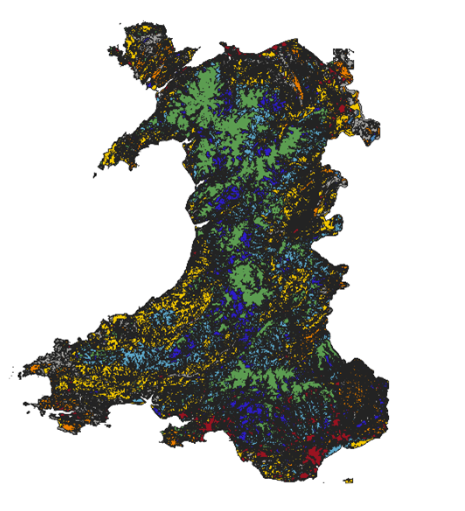
In Wales, the ALC system is the same as the one used in England with the exception that the Welsh Government developed an online tool7 that predicts the ALC grade in accordance with the 1988 system that subdivides Grade 3:
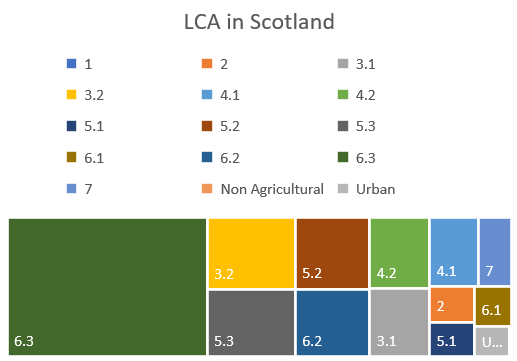
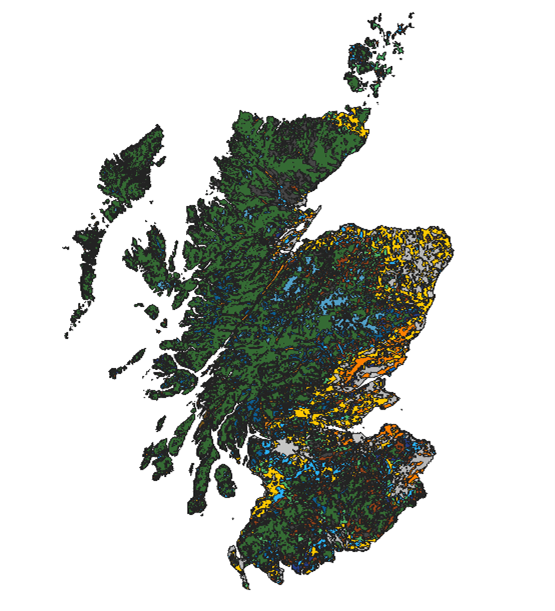
Scotland’s Land Capability for Agriculture (LCA)8 is different to that of England and Wales. This system recognises 13 separate divisions under 7 classes of land:
The difference between the information available at the strategic planning level, compared with the data obtained at the planning application stage, provides context to some of the questions that are asked about solar and land use. ALC or LCA maps are at a resolution where much of the data is predicted, based on limited real-world data, or, in some cases, derived anecdotally. As such, individual planning applications can still rely on site surveys to generate land classification data of sufficient quality.
Solar developers are careful to avoid BMV land wherever possible, but in any case, solar sites occupy a very small proportion of land. The common statistic that we have heard is that currently, solar covers just 0.1% of all land in the UK. Based on the government’s plans of 70GW of solar and to be net zero by 2035, solar deployment would need to be at 0.3% of the UK land use. To put this in context, this is equivalent to 0.5% of the land currently used for farming.
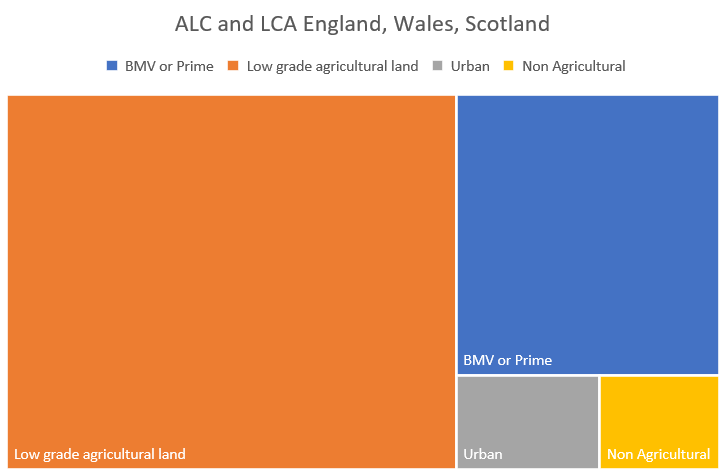
Around 70%9 of the total agricultural land in England, Wales and Scotland is not, or is very unlikely to be, classified as BMV (ALC grades 1, 2 and 3a) or Prime Agricultural land (LCA grades 1, 2 and 3.1). Our analysis shows that combined picture of land grade across England, Scotland and Wales looks approximately like this:
The ALC system for Northern Ireland is the same as that of England and Wales, however there are no digitally published maps available to inform this analysis. In the absence of high-level ALC maps, developers would rely on detailed surveys to ascertain BMV land at the point of planning.
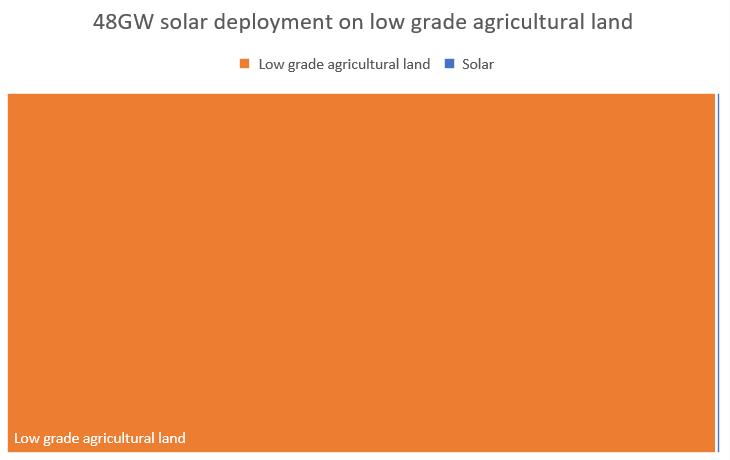
It is estimated that there is approximately 15GW of installed solar capacity across the UK10 and the Government’s stated ambition is to see a five-fold increase in solar by 2035, to 70GW11. New solar farms occupy approximately 2-4 acres of land per MW12. This means that 48GW of the 70GW target would be ground-mounted solar, comprising: 9.6GW of existing solar farms occupying an average of 6 acres/MW; and 38.2GW of new solar farms occupying an average of 3 acres13.
Therefore, installing solar in line with the ground-mounted solar estimate of 48GW would therefore require approximately 697km2 (172,200 acres), 0.5% of low-grade agricultural land.
This is insignificant when you consider the scale of land use change in general. For example, one study14 that quantifies land use change across Great Britain demonstrated a total net land use change of 20,600km2 looking at data from 2005 to 2013. Furthermore, a 0.5% reduction in low grade agricultural land would have negligible (if any) impact on farming outputs when viewed in context of 17% interannual variability in crop yields due to climate and biophysical factors15.
Brownfield sites and rooftops are regularly suggested as alternatives to siting solar projects on agricultural land (of any grade). However, while there is scope for some development in this area, brownfield sites and rooftop solar face their own complexities. Pace of deployment is vital if the UK is to decarbonise its power system by 2035 and realise Net Zero by 2050. Prolonged policy uncertainty, particularly with respect to land use and the Electricity Generator Levy16, has stymied investment and delayed many projects, leaving the UK behind the curve. A key attraction of solar PV is that it is, by a long way, the fastest renewable generation technology that can be deployed17. However, the additional environmental remediation processes such as site clearance and approval from regulators, that are associated with brownfield sites18, increases the cost of deployment and materially delay construction timelines, rendering many of these projects uninvestable. This will increasingly be the case as more solar and other renewable generation technologies are deployed, reducing the revenues that a new project can expect to generate over its lifetime.
Rooftop solar has grown rapidly in recent years but inefficiencies when compared to utility-scale solar remain. Rooftop solar projects are typically located in urban dense environments surrounded by other buildings, so panels are often shaded, reducing their ability to generate. The panels can only be mounted rigidly at what is called the roof pitch, which is the angle of the roof19. This is often not the optimal angle for capturing solar irradiance. By contrast, ground-mounted solar can be mounted at the optimal tilt angle20 to maximise generation from the path of the sun, thereby increasing efficiency and energy generation. The results from a study21 proved that not only is utility-scale solar half the cost per kWh of electricity produced compared to residential scale systems, but it also avoids approximately 50% more carbon emissions as well. Both systems can work in tandem to achieve the target of 70GW by 2035, but an approach to policy reform should recognise that utility-scale solar offers a cost-efficient, quick-to-deploy solution that targets energy and climate security.
Land and the pressures on its use must be at the forefront of conversation and policy reform. However, land use frameworks must be designed with multifunctional land use and natural capital concepts22 at their core and must avoid treating land use needs as if they are mutually exclusive.
Footnotes:
[1]https://www.ons.gov.uk/peoplepopulationandcommunity/populationandmigration/populationestimates/articles/overviewoftheukpopulation/2020
[2]https://www.fao.org/fileadmin/templates/faoitaly/documents/pdf/pdf_Food_Security_Cocept_Note.pdf
[3]https://www.gov.uk/government/publications/british-energy-security-strategy/british-energy-security-strategy
[4]https://solarenergyuk.org/wp-content/uploads/2022/09/Briefing-Solar-Farms-Food-Security_The-Facts_Sept2022.pdf
[5]https://www.nationalfoodstrategy.org/the-report/
[6]https://www.gov.uk/government/consultations/levelling-up-and-regeneration-bill-reforms-to-national-planning-policy/levelling-up-and-regeneration-bill-reforms-to-national-planning-policy#chapter-7–protecting-the-environment-and-tackling-climate-change
[7]http://lle.gov.wales/catalogue/item/PredictiveAgriculturalLandClassificationALCMap/?lang=en
[8]Bibby, J.S, Douglas, H.A, Thomasson, A.J. and Robertson, J.S. (1982), Land capability classification for agriculture. Macaulay Institute for Soil Research.
[9]This figure considers the resolution of England’s ALC data whereby Grade 3 has a dataset that is not subdivided. Ratios in ALC 3a and 3b in Wales and LCA 3.1 and 3.2 in Scotland are 1:2.4 and 1:1.5 respectively, so for purposes of this estimate, a very precautionary assumption of 1:1 has been used to subdivide England’s ALC Grade 3.
[10]https://solarenergyuk.org/uk-solar-energy-industry-comes-of-age/
[11]https://www.gov.uk/government/publications/british-energy-security-strategy/british-energy-security-strategy
[12]https://assets.publishing.service.gov.uk/government/uploads/system/uploads/attachment_data/file/1015236/en-3-draft-for-consultation.pdf
[13]https://solarenergyuk.org/wp-content/uploads/2022/09/Briefing-Solar-Farms-Food-Security_The-Facts_Sept2022.pdf
[14]https://nora.nerc.ac.uk/id/eprint/519376/1/N519376JA.pdf
[15]https://iopscience.iop.org/article/10.1088/1748-9326/ac2965
[16]https://www.gov.uk/government/publications/electricity-generator-levy
[17]https://solarenergyuk.org/wp-content/uploads/2022/03/Briefing-Energy-Security-Strategy.pdf.
[18]https://www.pbctoday.co.uk/news/planning-construction-news/brownfield-vs-greenfield-construction/48170/
[19]https://energycentral.com/c/gn/why-roof-top-solar-panels-really-dont-make-sense
[20]https://solar-energy.technology/photovoltaics/elements/solar-tracker
[21]https://www.brattle.com/wp-content/uploads/2017/10/7626_comparative_generation_costs_of_utility-scale_and_residential-scale_pv_in_xcel_energy_colorados_service_area-3.pdf
[22]https://www.nextenergysolarfund.com/esg/esg-biodiversity-naturalcapitalseries/